The
PerfView is a performance analysis
tool from Microsoft, the tool can be used to analyze application performance of
both Windows and Web based applications. In this post we shall see on how to
analyze the data from the Managed Stack, to determine the memory utilization of
the application.
To analyze the Memory utilization and Stack details of an application follow the below steps.
1. Open PerfView.exe
2. Select Collect -> Collect
3. Leave all the settings as it is and click on the Start Collection button.
4. Open the application which you want to profile.
5. Work on the application and close it.
6. Back in the PerfView interface click on the Stop Collect button.
7. PerfView will analyze the trace information and display the reports in the left side tree as follows.
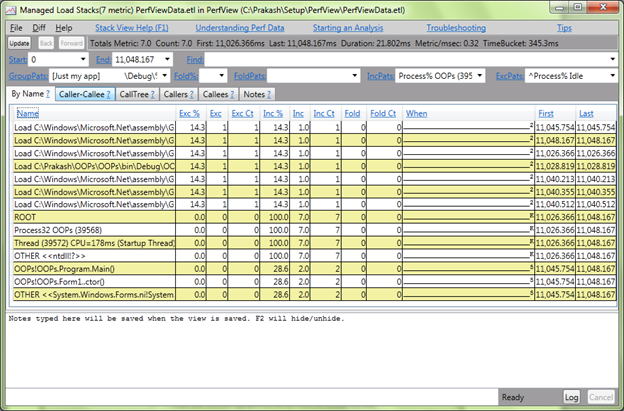
8. Double
Click on the Managed Load Stacks node in the tree.
9. This will open up a pop-up with the list of all the processes which were analyzed.
10. Identify your application / process and double click on the process
11. This will open up another pop-up window with details of the Stack as follows
9. This will open up a pop-up with the list of all the processes which were analyzed.
10. Identify your application / process and double click on the process
11. This will open up another pop-up window with details of the Stack as follows


No comments:
Post a Comment